Learn how to use DAX to track hires, exits, and transfers, to ensure accurate employee status monitoring.
Learn how to use status tracking measures effectively in Power BI visualizations.
Table of Contents:
Introduction
In this article, we’ll explore a powerful application of DAX and Power BI for status tracking, focusing on a typical Human Resources (HR) use case. Employees undergo constant status changes, such as promotions, transfers, or changes in working hours. Using only current employee status data limits historical analysis of crucial HR KPIs, like promotions or workforce seniority changes.
In this HR case example, we’ll illustrate how status tracking can be implemented in Power BI. The step-by-step guide will demonstrate creating robust measures for tracking headcount monthly or yearly, along with slicers for office locations to monitor employee transfers between offices.
Data Transformation and Model Creation
In this Power BI and DAX analysis, we work with two primary tables which are imported from an excel file: the Employee Lookup table and the Status Log table. Let’s take a closer look at the tables.
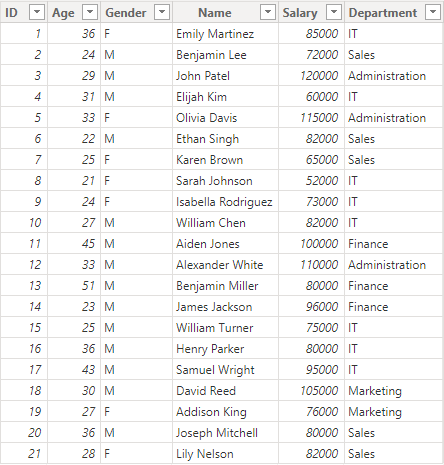
Employee Lookup table: This table serves as our employee database, providing essential information to identify individuals. It includes the following columns:
ID: A unique identifier for each employee.
Age: The age of the employee.
Gender: The gender of the employee.
Name: The name of the employee.
Salary: The current salary of the employee.
Department: The department in which the employee works.
Figure 1: Employee Lookup table
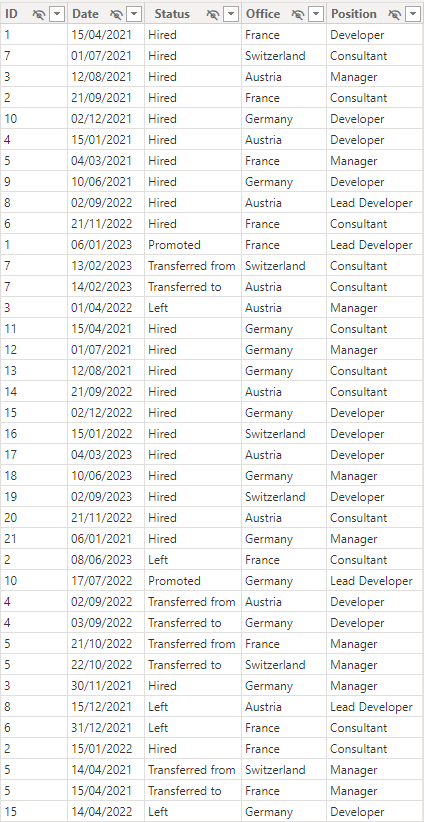
Status Log table: This table tracks the various status changes for employees over time. It includes the unique key „ID“ column from the Employee Lookup table and introduces additional important data points included in the following columns:
Date: A date column that records the precise date when a status change occurred.
Office: This column specifies the location of the office where the employee is situated.
Position: It defines the job position or title held by the employee.
Status: The Status column captures the nature of the status change, which can take on one of the following values:
„Hired“: Denotes the initial employment of an individual.
„Promoted“: Reflects an employee’s advancement within the organization.
„Transferred from“: Indicates an employee’s transition from one office or location.
„Transferred to“: Represents an employee’s relocation to a different office or location.
„Left“: Marks the end of an individual’s employment with the company.
Figure 2: Status Log table
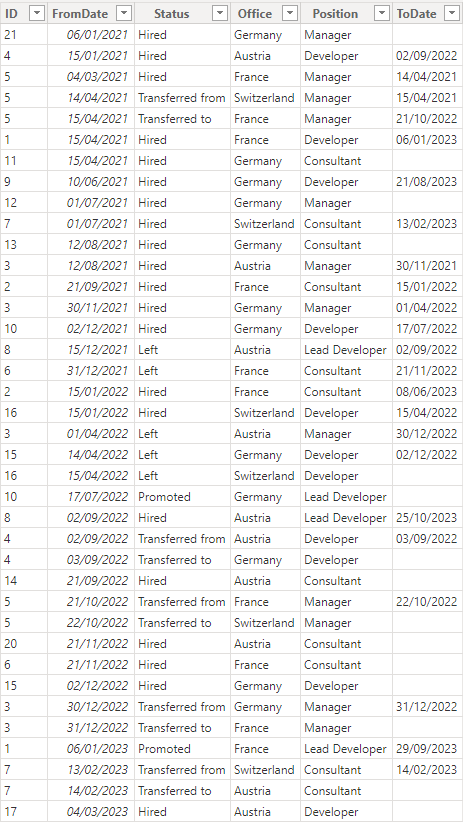
To create meaningful measures for tracking hired employees and total headcount, we need to enhance the status log table. Although the table has a „Date“ column indicating when changes occurred, it lacks explicit information on the duration of a specific status. This gap complicates measure creation and hinders computational efficiency.
Using Power Query, we can transform the status log table into a „Status Log From-To“ table, providing explicit information on the duration of each status update. To see exactly how it’s done, download the PowerBI file at the end of the article. This new table introduces two crucial date columns: „FromDate“ and „ToDate.“ These columns define the timespan during which a particular status change is valid. For example, if an employee was hired on 10/7/2019 and then promoted on 31/1/2020, the corresponding row for the hired status would have a „FromDate“ of 10/7/2019 and a „ToDate“ of 31/1/2020.
Figure 3: Status Log From-To table
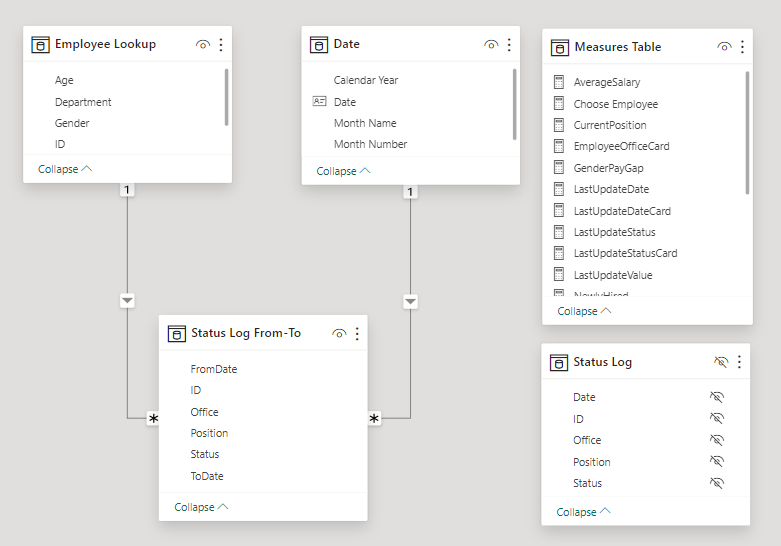
To create an effective data model „Status Log From-to“ is linked with the Employee Lookup table and a Date table, forming the basis for our analysis. Therefore relationships were created between the following tables:
Date table and Status Log From-To: A relationship was established between the Date column of a dedicated Date table and the ‚FromDate‘ column in the Status Log From-To table. This relationship allowed us to perform time-based analysis, enabling the tracking of status changes over distinct periods.
Employee Lookup table and Status Log From-To table: An important connection was established by linking the Employee Lookup table and the Status Log From-To table through the unique „ID“ column. This relationship served as the bridge between employee data and their respective status change timelines.
Figure 4: Data model
Measures
We’ve created six key measures for tracking and visualizing employee status changes and overall headcount. Let’s take a closer look at these measures and how you can effectively utilize them in your visualizations.
NewlyHired, NewlyLeft, TransferredFrom and TransferredTo measures
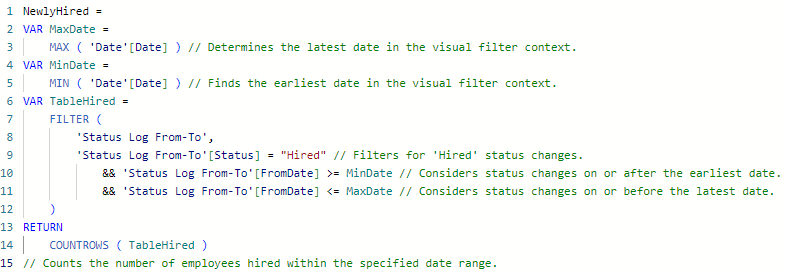
The first four measures, NewlyHired, NewlyLeft, TransferredFrom, and TransferredTo, are designed to monitor changes in employee status that directly impact the total employee count. Their structures are similar, focusing on specific status changes within a defined time interval. Take, for example, the NewlyHired measure:
Figure 5: NewlyHired measure
The variables MaxDate and MinDate store the earliest and latest dates visible in the filter context of the visual. Within this defined time interval, marked by MaxDate and MinDate, the TableHired variable captures the filtered ‚Status Log From-To‘ table for instances where the status is „Hired“. Subsequently, the NewlyHired measure returns the count of rows corresponding to employees hired during that time period. Essentially, this measure monitors or tallies changes within a time interval specified by the visual filter context. A similar rationale applies to the NewlyLeft, TransferredFrom, and TransferredTo measures, each filtered based on the respective status change.
Total employees
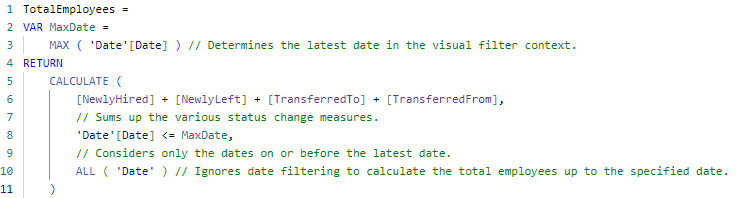
TotalEmployees is a comprehensive measure that sums up the four status change measures—NewlyHired, NewlyLeft, TransferredTo, and TransferredFrom. It provides a snapshot of the total number of employees up to a specific date defined by the MaxDate variable, respecting the visual filter context.
Figure 6: TotalEmployees measure
This measure is particularly useful for showcasing the evolving total employee count in response to a changing date filter context.
Total positions
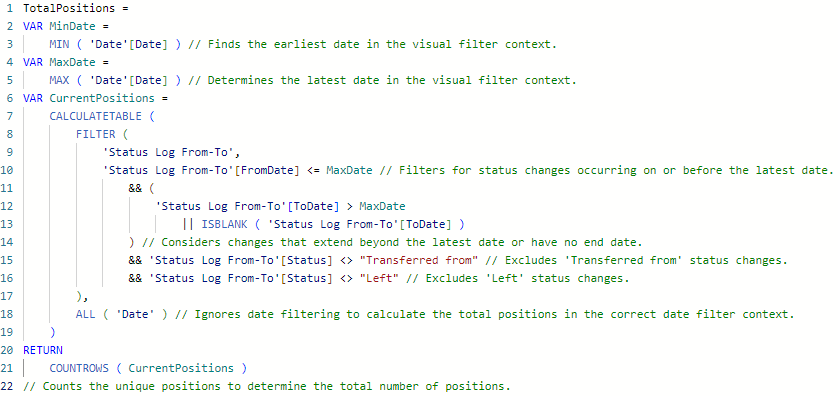
The sixth measure, TotalPositions, is used to showcase the total employee count by position. This measure addresses a limitation of TotalEmployees, as it doesn’t account for changes in an employee’s position through promotions or other means. TotalPositions is defined as follows:
Figure 7: TotalPositions measure
The TotalPositions measure calculates the number of unique positions held by employees within the specified date range, considering promotions, status changes, and position history. This measure is valuable for visualizing the distribution of employees across different positions in your organization.
Latest status update
In addition to our primary measures, we’ve introduced three essential metrics to enhance your understanding of employee status changes: LastUpdateDate, LastUpdateStatus, and LastUpdateValue.
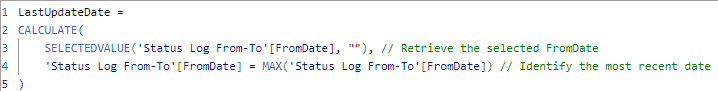
The LastUpdateDate measure extracts the date of the last status update for a specific employee. It navigates through the ‚Status Log From-To‘ table to find the most recent change. This measure is important as it’s used in the following two measures to identify the most recent status changes.
Figure 8: LastUpdateDate
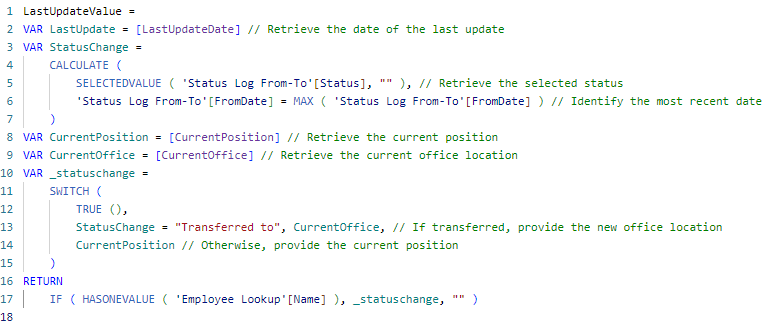
The LastUpdateStatus measure captures the nature of the last status change, offering details like whether it was a transfer, hire, or promotion. It provides a snapshot of the most recent employee transition.
Figure 9: LastUpdateStatus
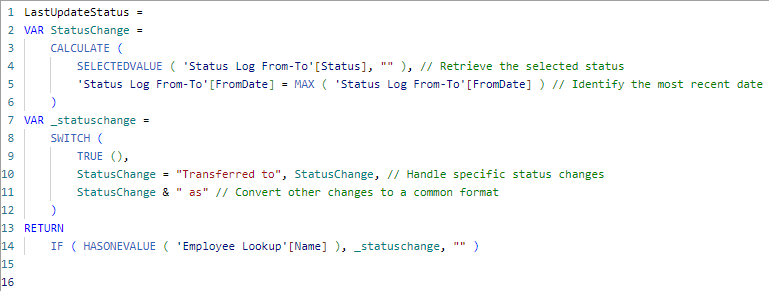
The LastUpdateValue measure provides information regarding the specific property affected by the last status change whether it’s a new office location or a change in position.
Figure 10: LastUpdateValue
These measures are effective in visualizing the latest updates in employee status, adding a layer of depth to your HR analytics toolkit. Now, let’s explore how you can effectively visualize these measures.
Visualizing the measures
Headcount tracking with matrix visuals
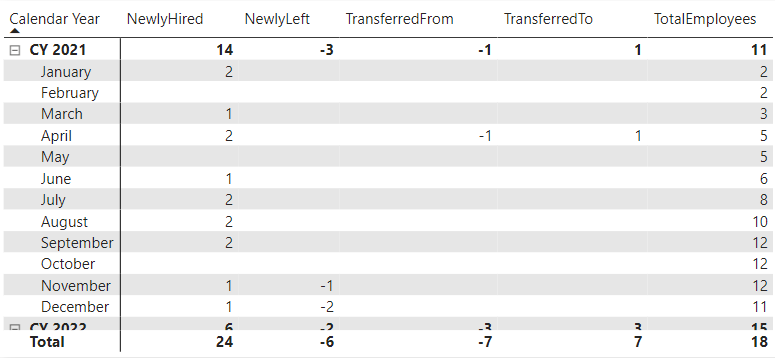
To effectively visualize these measures, consider using a matrix visual. The rows can be defined by the year and month name columns of the date table, providing a clear timeline. The matrix values can then be populated with the measures: NewlyHired, NewlyLeft, TransferredTo, TransferredFrom, and TotalEmployees. This setup allows you to track the changes in employee status within the specified date filter context while also providing an overview of the total number of employees up to the chosen date.
Figure 11: Status change matrix visual
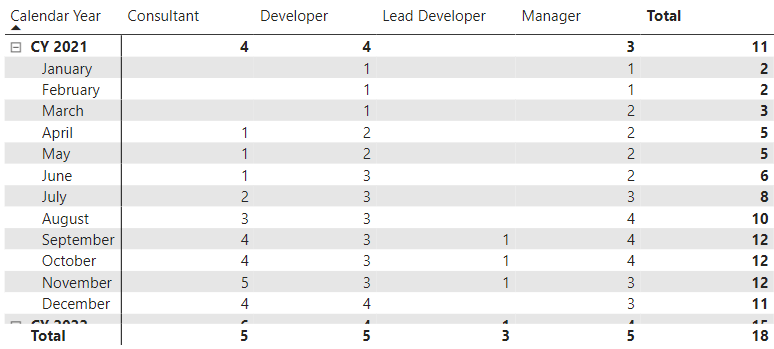
The TotalPositions measure can also be used in a matrix visual effectively. In this matrix, the rows are defined by the calendar year and month name columns of the date table, offering a chronological view. The columns are defined by the Position column from the Status Log From-To table. Finally, the values in the matrix are populated with the TotalPositions measure. This visualization allows you to track the total number of employees filtered by their respective positions over time, offering valuable insights into your organization’s workforce dynamics and distribution by role.
Figure 12: Total number of employees by position matrix visual
With an added Office slicer, you can further dissect the data, enabling you to analyze and compare changes in different offices or locations.
Latest status update with card visuals
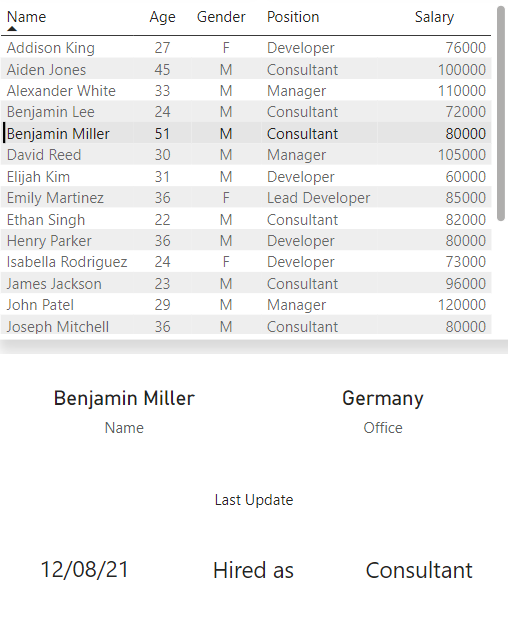
Incorporating the LastUpdateStatus and LastUpdateValue measures into card visuals increases the accuracy of visualizing an employee’s most recent status change. Simply clicking or highlighting an employee’s name in the Employee Lookup table visual triggers an immediate update in the corresponding card visuals. The LastUpdateStatus card dynamically displays the nature of the most recent status change, whether it’s a transfer, promotion, or a specific hiring or leaving event. At the same time, the LastUpdateValue card displays the specific property affected by the last status change, whether it is a new office location or a changed position within the organization. This interactive approach allows HR analysts and decision makers to easily navigate and explore the latest status updates for individual employees. The embedded image visually illustrates this setup.
Figure 13: Latest status update visuals
Conclusion
In our exploration of Status Log data using Power BI and DAX, we explained the process of creating measures to accurately track and analyze status changes. Starting with key data transformation steps, we defined six key measures – NewlyHired, NewlyLeft, TransferredFrom, TransferredTo, TotalEmployees, and TotalPositions. In addition, we introduced the LastUpdateStatus and LastUpdateValue measures, expanding our analytical capabilities to accurately visualize status changes at the individual employee level. This methodology provides a robust framework for monitoring data changes, providing detailed insight into business dynamics and enabling data-driven decision making in the Power BI environment.
Download the Power BI and Excel files
By clicking the download button below, you can download the file used to create the dashboard in this article for free. No email or other requirements are needed.