
Austrian Gas Flow Dashboard in Power BI

Stefan Dangubic | Business Intelligence
16. November 2023
Topics
- Overview and features of the Austrian Gas Flow Dashboard
- Technical implementation of the Dashboard using Microsoft Azure and Power BI
Introduction
This article presents the Austrian Gas Flow Dashboard. The Dashboard was developed as a Power BI showcase for the energy sector. The article focuses on the functionalities of the Dashboard and the technical implementation in Microsoft Azure.
Austrian Gas Flow Dashboard: Inhalte
The dashboard visualises the daily natural gas flows from neighbouring countries to Austria and provides the following key information:
- Overview of physical gas flows between Austria and its neighbouring countries.
- Injection and withdrawal volumes of the gas storage facilities marketed by OMV, RAG, Uniper and Astora.
- Information on domestic natural gas production by OMV and RAG.
- Quantity of biogas fed into the natural gas grid.
- Gas consumption by households and industry.
The Austrian gas grid consists of the independent market areas East, Tyrol and Vorarlberg. The Dashboard shows gas consumption and biogas production aggregated for the three market areas. Gas is only produced and stored in the Eastern market area.
The Dashboard is particularly important in the context of Austria's efforts to diversify its natural gas sources. At the time of writing, the majority of Austria's natural gas imports come from Slovakia via the Baumgarten entry point. The gas imported from Slovakia is mainly Russian gas, which reaches Austria via Ukraine and Slovakia. It is therefore expected that gas flows from Slovakia will decrease in the future and be replaced by gas flows from Germany via the Oberkappel entry point. The expected shift in supply flows in the coming years can be analysed using the Dashboard.
Austrian Gas Flow Dashboard: Technical implementation
The aim of our showcases is to retrieve raw data from Austrian Gas Grid Management AG (AGGM) via an API, process it and publish it to the dashboard on a daily basis. Specifically, the following steps need to be taken:
- Data retrieval: Data retrieval from the web using a tool that supports HTTP requests.
- Data transformation: The raw data must be transformed in an ETL process (Extract, Transform, Load) so that it can be saved in a database.
- Data storage: Storage of the transformed data in a relational database. Common options are Microsoft SQL Server, Maria DB, MySQL and PostgreSQL.
- Scheduling: Scheduling tool for the daily execution of processes and updating of data.
- Web dashboard: Finally, the relevant KPIs and charts must be published on the web dashboard.
There is a long list of tools that can be used to implement such a process. In theory, the whole process could be implemented using a Python script. However, most scenarios involving large amounts of enterprise data require scalable tools that can read and transform large data sets. In our case, we decided to implement the project using the services available in Microsoft Azure. The following graphic shows the architecture of our solution:
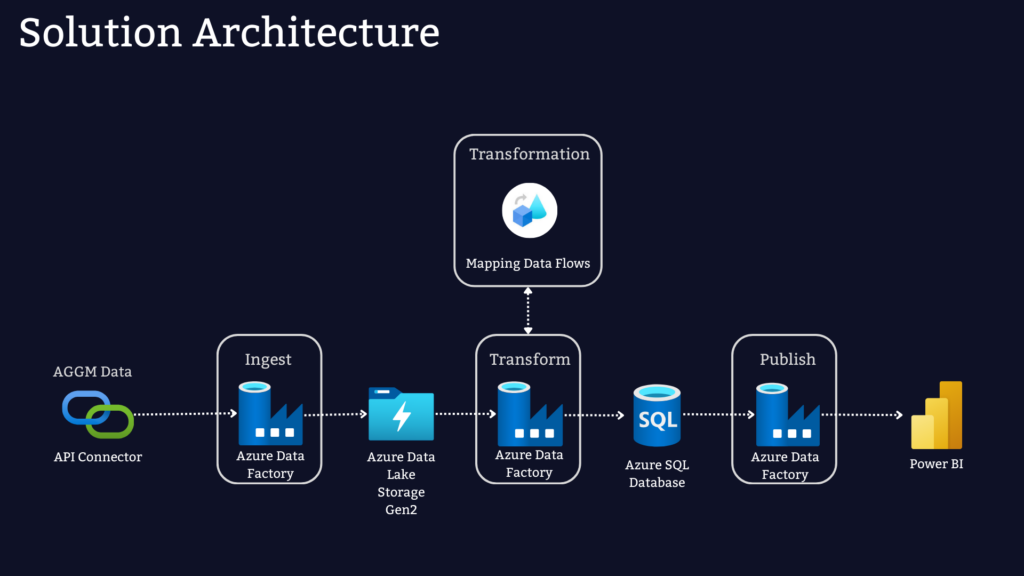
Azure Data Factory (ADF) is used in our case as a service for data retrieval, data transformation and scheduling. Azure Data Factory provides Linked Services that can be used to retrieve data from the web. The raw data retrieved from AGGM as an XML file is stored in an Azure Data Lake. Data Flow, a code-free data transformation service within Azure Data Factory, cleanses the data. Data Flow is suitable for large volumes of data where the transformation logic is not too complex. The transformed data is then stored in an Azure SQL database. A trigger available in ADF is used to schedule the process. Finally, the visualisations and metrics are calculated in Power BI and published to the web.
Support with financial modelling, valuation, data analytics, Excel and Power BI.
Walecon e.U.
Gentzgasse 148/1/5
1180 Vienna
Austria
Walecon is a co-signatory of
